top of page

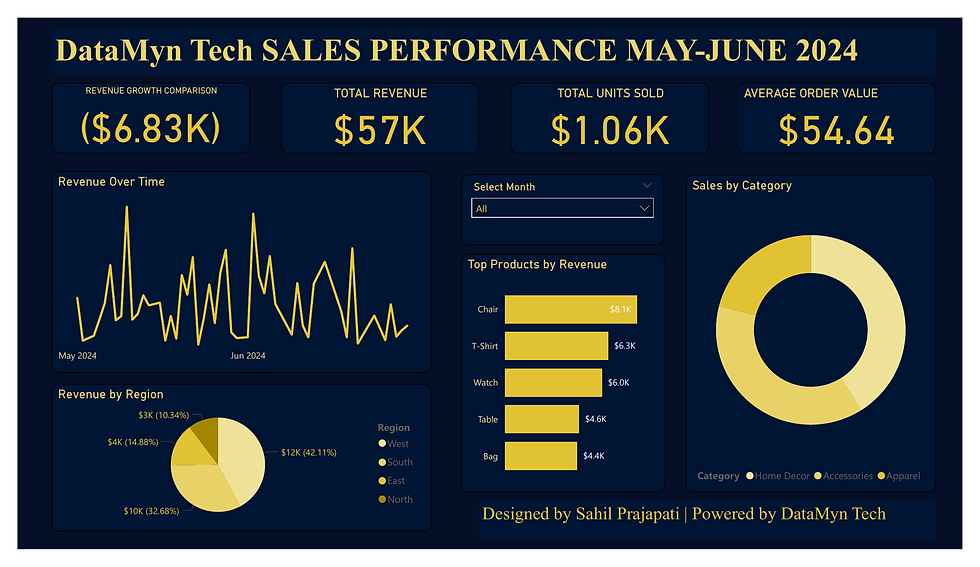
📊 Sales Performance Dashboard (May–June 2024)
Client:
Demo Project
Year:
2025
This Power BI dashboard tracks key sales performance metrics including total revenue, average order value, and units sold across multiple regions. It highlights top products, compares regional growth, and shows month-over-month trends. Ideal for teams needing a quick view of performance across categories.

bottom of page